Every enterprise product designer has lived through this moment.
You spend months conducting stakeholder interviews, building clean component libraries, and designing a modern web interface. You replace a clunky legacy system with something that looks like it was designed in Silicon Valley yesterday: crisp white backgrounds, 16px padding, elegant card containers, and smooth modal drawers.
You launch it. You demo it to the operational team that actually keeps the organization running.
There’s a polite pause. Then someone clears their throat and asks:
"This looks great. But where is the button to export all of this to Excel?"
In tech post-mortems, we love to dismiss this reaction. We tell ourselves the users are "resistant to change," "stuck in their ways," or "not tech-savvy."
That diagnosis is usually wrong.
Enterprise users don’t cling to spreadsheets because they love Microsoft or hate change. They cling to spreadsheets because modern consumer design patterns actively get in the way of high-stakes operational work.
I learned this firsthand while leading the UX for a funded research initiative at the University of Washington: the UW COBie (Construction Operations Building Information Exchange) Pilot Project, partnered with the UW Capital Projects Office and the Department of Construction Management.
Our goal was noble: replace massive spreadsheets and clunky legacy software (like AssetWorks AiM) with a modern, GIS-enabled web interface for campus facilities leads and maintenance technicians.
The dataset was real: over 30,000 rows of complex building assets—chillers, air handlers, steam lines, thermostats, and electrical panels across millions of square feet of campus buildings. The baseline? Under the legacy system, finding an equipment manual or replacement part during an active building emergency took an average of 18.2 minutes.
We tested our interactive prototype in Sieg Hall with veteran facilities leads. Watching them interact with our "modern" design shattered many of our textbook design assumptions.
Here are the 5 biggest lessons we learned—and why they explain why enterprise software so frequently fails the people who need it most.
Lesson 1: When "3" Doesn't Mean 3 (The Semiotic Trap)
To indicate urgency on our work order cards and campus map, our team created a 3-tier priority scale:
3 - High (Red)
2 - Medium (Brown)
1 - Low (Cyan)

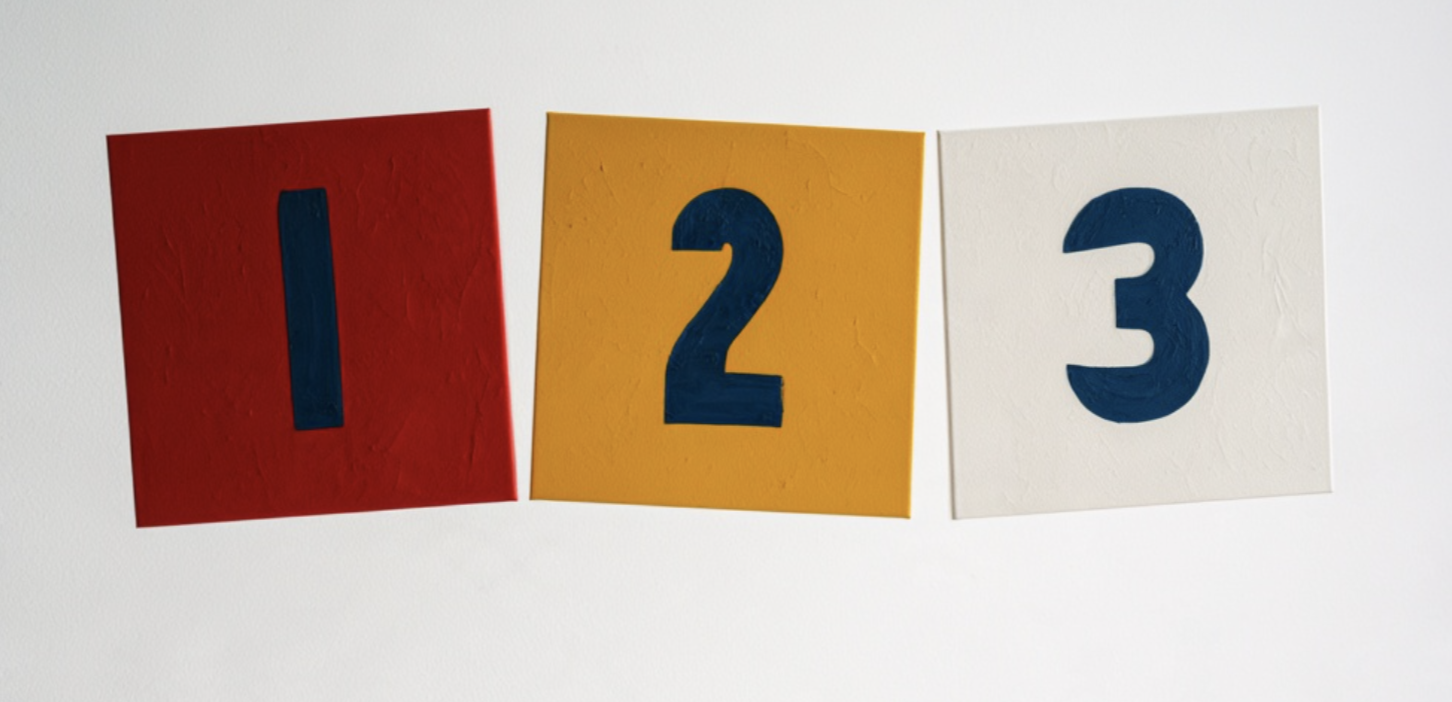
To us, it made mathematical sense: 3 is bigger than 1, so 3 is higher priority.
To the facilities leads, it was an immediate disaster.
In real-world operations, Priority 1 (P1) is always the emergency. P1 means an active pipe burst in a chemistry lab or a power outage in a medical center. Priority 3 is a squeaky door hinge you fix next month. By inverting the number scale, we completely scrambled their operational reflexes.
Worse, on our GIS campus map view, we placed a red circular badge with the number 3 over a building.
The participants immediately assumed there were 3 separate work orders inside that building—not that a single Priority 3 work order existed.
The Lesson: Never invent your own semiotics for established domains. Operational conventions (P1 = Emergency) are hardwired into muscle memory. If you use a number inside a badge on a spatial map, users will always read it as a count, not a category.
Lesson 2: "I'm Not a Micromanager" (The Communication Anti-Pattern)
We designed a feature allowing facilities leads to assign tasks to technicians. During one test, we asked a lead to help his technician, Dan, locate a faulty thermostat, identify which rooms it controlled, and provide instructions.
We proudly gave the lead a blank messaging box to type out directions.
The participant refused to type in it. He looked at us and said:
"I am not a micromanager. They should be able to see most of the stuff in the website themselves, and it should be easy for them to interpret things without my help."
He didn’t want to type a narrative email. What he actually wanted was simple: select the thermostat in the side panel (which already showed the connected rooms) and click a single button to forward the asset payload directly to Dan's mobile device.
The Lesson: Enterprise tools shouldn't turn supervisors into human message routers. When software asks managers to manually re-type data the system already knows, it’s not facilitating collaboration—it’s imposing an administrative tax.
Lesson 3: The Pop-Up Trap ("It Doesn't Contain Everything in One Window")
To keep our interface "clean" and avoid overwhelming the user, we followed standard consumer UX best practices: progressive disclosure. We tucked technical details into nested tabs and secondary pop-ups.
Our usability report flagged this as a primary failure:
"The pop-up window does not contain all necessary information in one single window."
To diagnose an overheating room, the participant had to:
Select the HVAC system from the left panel to see the floor's ductwork.
Click the room on the floor plan map.
Check a box labeled "Show Thermostat" to reveal the controls.
The participant was exasperated. When investigating an equipment failure, an engineer doesn't want to play hide-and-seek with dropdown menus. They wanted all connected assets, pipelines, and controls for that room visible and checked by default.
The Lesson: In operational diagnostics, progressive disclosure is often an anti-pattern. Hiding critical dependencies behind clicks and modals creates cognitive amnesia. Expert users need co-planar visibility—the pump, the pipe, the valve, and the room all visible on one screen at the same time.
Lesson 4: Your Backend Jargon Is Showing ("Facnum and Far-code")
In our global search bar, our wireframe displayed helpful grey placeholder text:
"Search: Facnum, Far-code, or long name"
To the database engineers, Facnum (Facility Number) and Far-code were standard architectural database attributes.
To the facilities leads, it was an immediate stop sign. When asked to find work orders in the "Central Zone," they hesitated to type into the search bar because they didn't know if the system accepted natural words, or if it strictly required an alphanumeric code.
The Lesson: Never leak database schema names into user-facing search bars. Operators think in human geography ("Central Zone", "Health Sciences Building") and functional asset tags ("Chiller #2"). The search engine’s job is to translate human taxonomy into database queries—not force humans to memorize backend syntax.
Lesson 5: "I Don't Know What I'm Signing Up For!" (SSO & Context Recovery)
Like good web designers, we put an oversized primary button on our landing page: "Sign Up", with a small secondary link for "Sign In."
A participant immediately balked:
"I don't know what I am signing up for!"
In an enterprise or university setting, employees don't "sign up" for tools with an email address. They authenticate with single sign-on (UW NetID). A consumer pattern like "Sign Up" created immediate suspicion about data privacy and authority.
More importantly, the participants highlighted a feature they desperately needed that had nothing to do with visual polish: Session Restoration.
Facilities leads get interrupted constantly. A pipe bursts, a radio call comes in, or their session times out. When they log back in, they don't want a clean blank home screen. They want the browser to ask:
"Do you want to restore your last session?"
Having to re-navigate the campus map, zoom into the third floor of an engineering hall, and re-apply three filters is a 5-minute cognitive penalty every time they get interrupted.
Why Excel Keeps Winning
When we surveyed our participants after the study, the results were telling:
Clear Purpose: 4.8 / 5.0
Relevance to Daily Tasks: 4.6 / 5.0
Immediate Learnability: 2.8 / 5.0
They loved the vision of GIS asset tracking, but the interface introduced too much mechanical friction compared to their existing habits.
This brings us back to the spreadsheet. A spreadsheet is visually austere, but it is ergonomically honest:
It doesn't hide your data behind three modal clicks.
It doesn't reflow your layout when the window changes size, destroying your muscle memory.
It lets you scan 50 rows at once with your peripheral vision to spot statistical outliers.
It lets you operate at the speed of your keyboard shortcuts without touching a mouse.
As enterprise designers, our job isn't to force consumer minimalism onto expert operators. It is to build systems that combine the real benefits of modern software—data validation, spatial maps, live telemetry, and audit trails—with the speed, density, and spatial predictability of the spreadsheet.
True design empathy isn't about rounded corners and generous whitespace. It’s about building software that gets out of the way of the user’s hands.