How writing 6-pager research reports earned the respect of engineering leadership and turned customer insights into shipped code.
Across tech organizations, a familiar pattern plays out after usability studies: a design team spends weeks interviewing users, identifying critical workflow breakdowns, and packaging their findings into a 30-slide presentation deck.
The review meeting is scheduled with Product and Engineering. Discussion halts on an early slide over technical constraints or sample sizes. The team rushes through the remaining slides. The deck is shared in a Slack channel, acknowledged politely, and filed away. Two sprints later, the production software ships with the exact usability flaws the research identified.
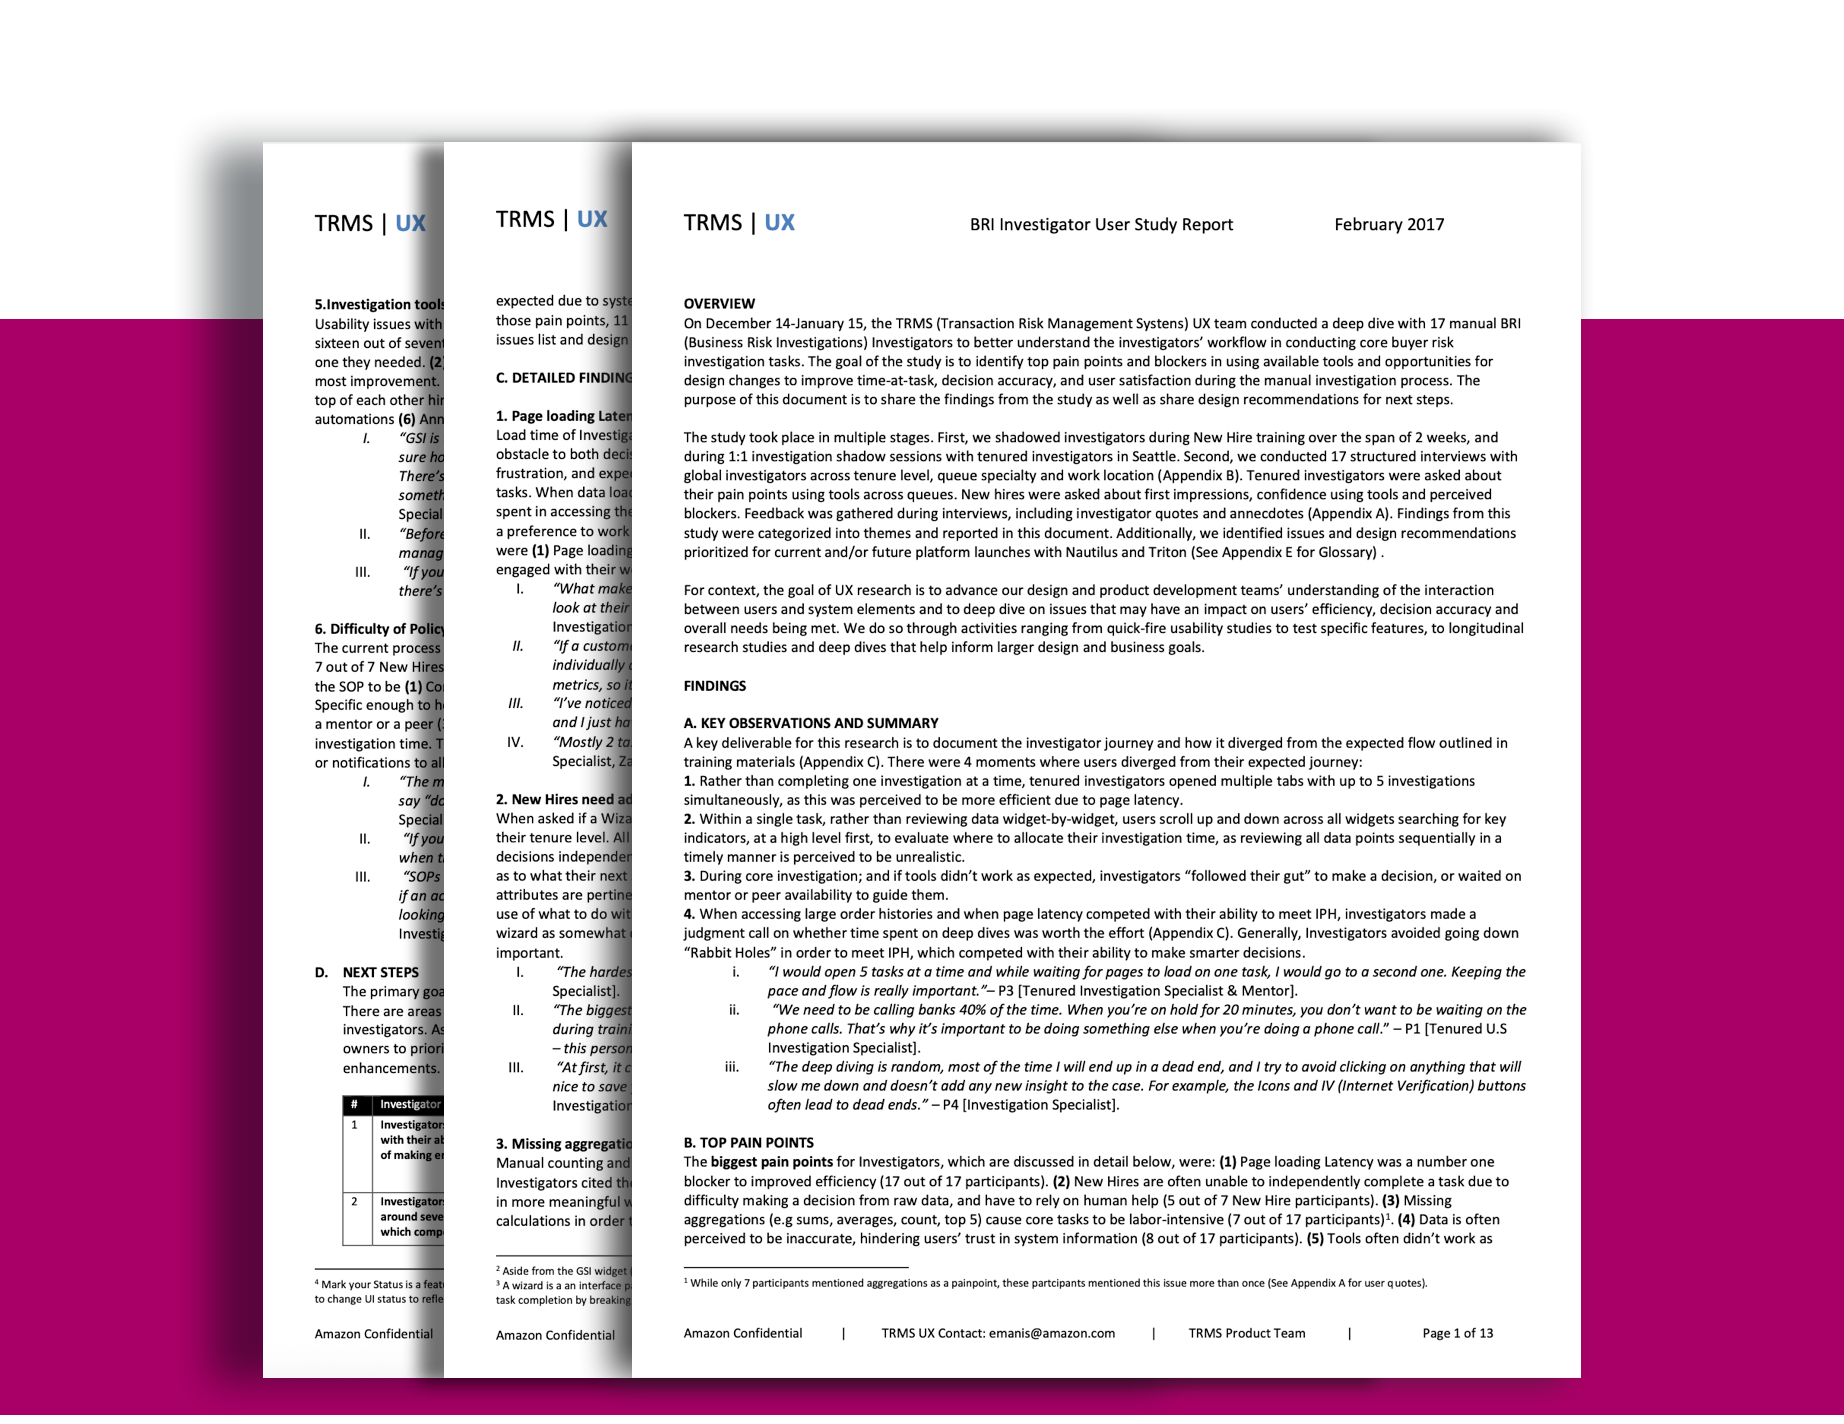
A 6-page research document written the Amazon Style (note that there were appendices that lead the total page count to be 13)
It is common to attribute this breakdown to short stakeholder attention spans or engineering indifference. In practice, the issue is structural: slide decks are fundamentally incompatible with multi-variable system diagnostics—this becomes particularly important in B2B and enterprise UX.
In consumer applications, user journeys are largely linear and transactional: a single consumer searches, adds an item to a cart, and checks out. If a user drops off, the friction point can often be summarized reasonably in a bullet point. B2B enterprise systems operate under an entirely different reality
The nature of B2B systems - Often times, B2B systems have one or more of the following qualities:
Relational Workflows - A single action taken by a procurement specialist triggers financial approvals, updates warehouse fulfillment queues, amongst other tasks. One user's output is another user's input.
High Operational Blast Radiuses - An ambiguous UI in an enterprise platform doesn't just mean a bounced session; it can result in misrouted freight, compliance breaches, SLA penalties, or millions of dollars in stalled transactions.
Deep Technical Constraints - Workflows are linked to complex databases, role-based access controls, asynchronous processing, and latency limits.
When teams attempt to compress these multi-layered dependencies into presentation slides, the medium breaks down. Is it difficult to represent relational workflow painpoints using bullet points and floating quote cards.
The Amazon 6 Page culture
Slide decks at Amazon were banned in high-stakes reviews. Major decisions including product strategy and customer research were driven by structured, written narratives: the 6-page memo, read silently at the start of the meeting.
Documents circulate far beyond the design team, reviewed and annotated by Product Directors and Principal Engineers resulting in better outcomes. Documents I wrote using the Amazon 6-Page format were cited by engineering leadership in technical retrospectives as the most effective research document they had evaluated - not because it was decorative, but because it treated technical architecture, business risk, and human behavioral data as a single, unvarnished system.
Functional Limits of Slide Decks
Slide software is designed for persuasion and high-level marketing pitches—environments where a presenter guides a passive audience through simplified ideas. User research in enterprise systems is diagnostic. It involves identifying where mental models clash with database structures, where system latency degrades user performance, and where edge-case workflows fail. Compressing this work into slide decks introduces three specific points of failure:
Removing context
Bullet points remove context. A bullet point stating "Users struggled to locate search filters" reads as a minor visual polish issue. A paragraph explaining that a dashboard reader spent 45 seconds scanning an unpredictable interface while an industrial chiller was actively overheating reveals an urgent operational defect. When causal details are stripped to fit a slide layout, technical stakeholders cannot accurately gauge the severity of the problem.
Friction with partner teams
In a slide presentation, information is revealed incrementally. When an engineer sees a proposed UI wireframe on slide 5, they evaluate it against unstated backend limitations, often interrupting to explain why an API cannot support that query. In a written narrative, the engineer would already have read on page 3 that the proposed interaction model eliminates that query entirely. Decks invite defensive debate because stakeholders are forced to react before the complete context is presented.
Recommendations Default to "Good Intentions"
The concluding slide of most research decks lists high-level recommendations: "Improve search discoverability" or "Streamline the checkout flow." In product development, good intentions rarely survive sprint planning. Without explicit, verifiable technical criteria, high-level recommendations cannot be converted into tracked engineering tickets and are systematically descoped.
The Core Mechanism: Coupling Telemetry with Customer Evidence
At Amazon, cross-functional evaluation relies on a deliberate balance:
"When data and anecdotes disagree, the anecdotes are usually right. It typically means you're measuring the wrong thing." - Jeff Bezos
In practice, a research report must never rely on quantitative metrics or qualitative quotes in isolation:
Quantitative metrics establish the operational scale and commercial liability (e.g., error rates, task completion slowdowns).
Qualitative observations reveal the user's mental model (e.g., what the human thought was happening when the system failed them).
The narrative synthesis connects both to justify specific, inspectable technical changes.
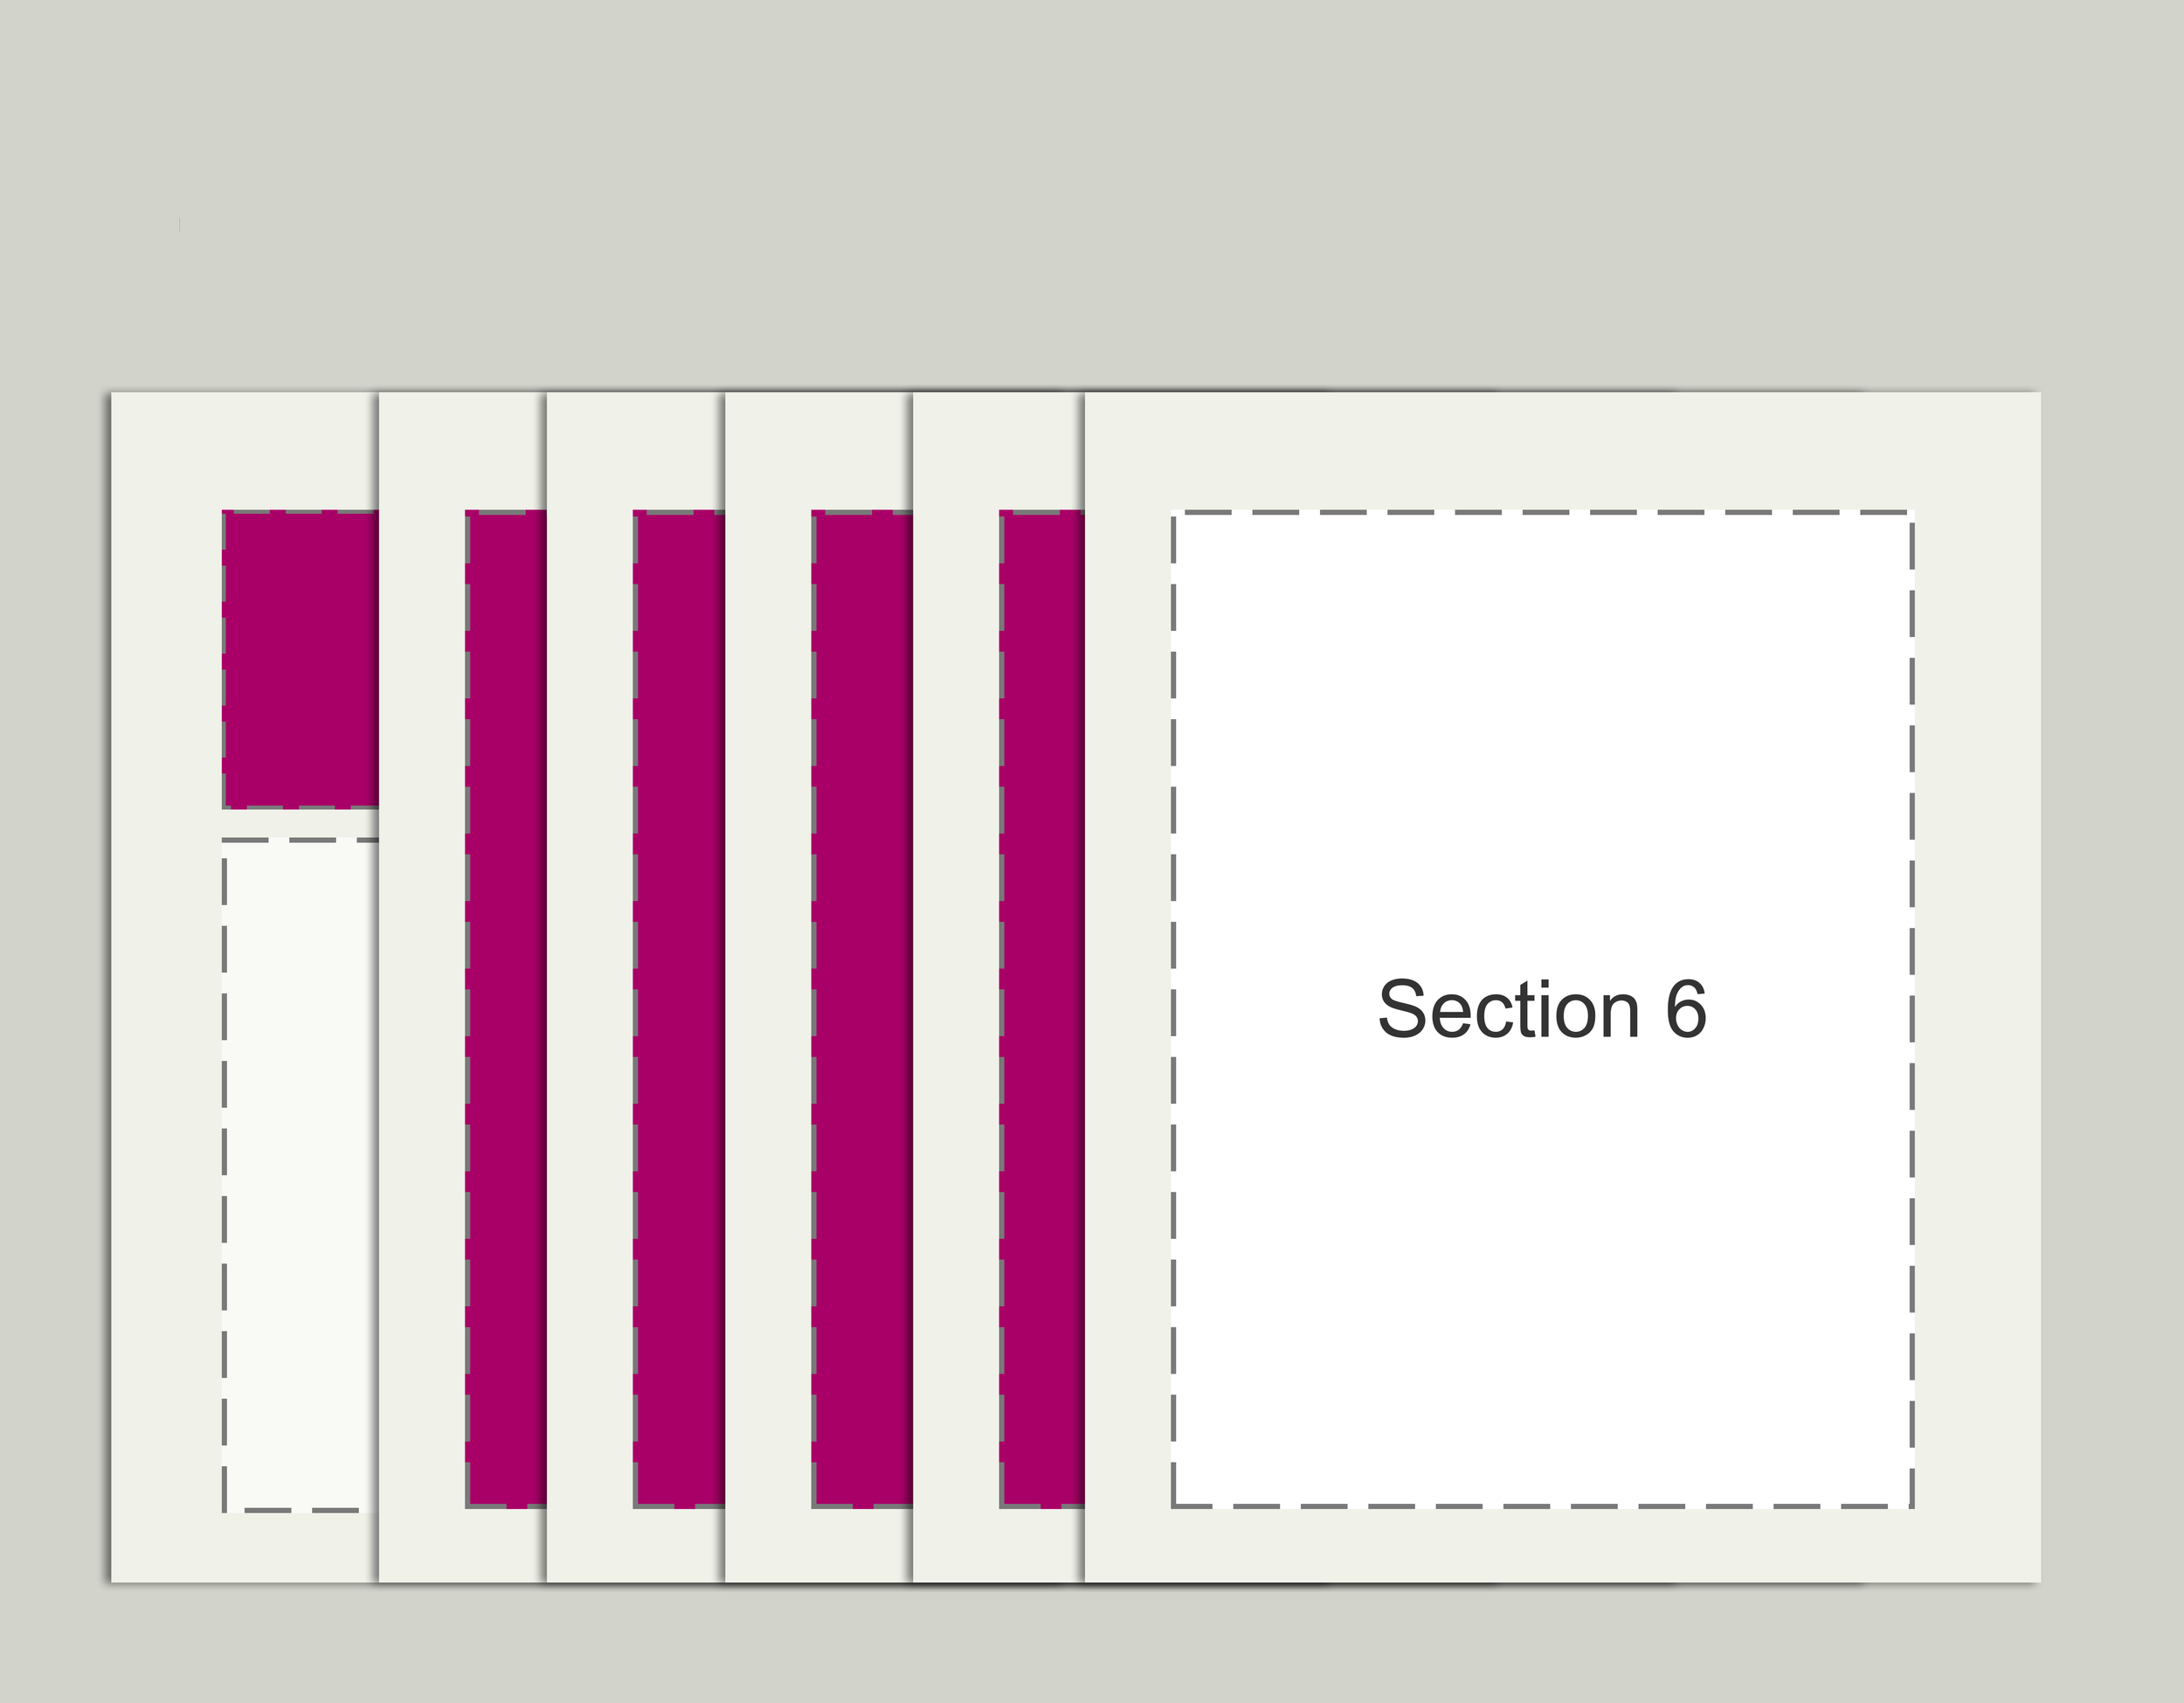
The 6-Section Blueprint
An effective research narrative is not an academic paper, nor is it an informal summary. It is an operational decision document designed to withstand rigorous interrogation from product, engineering, and data science leaders. It adheres to a 6-part structure:
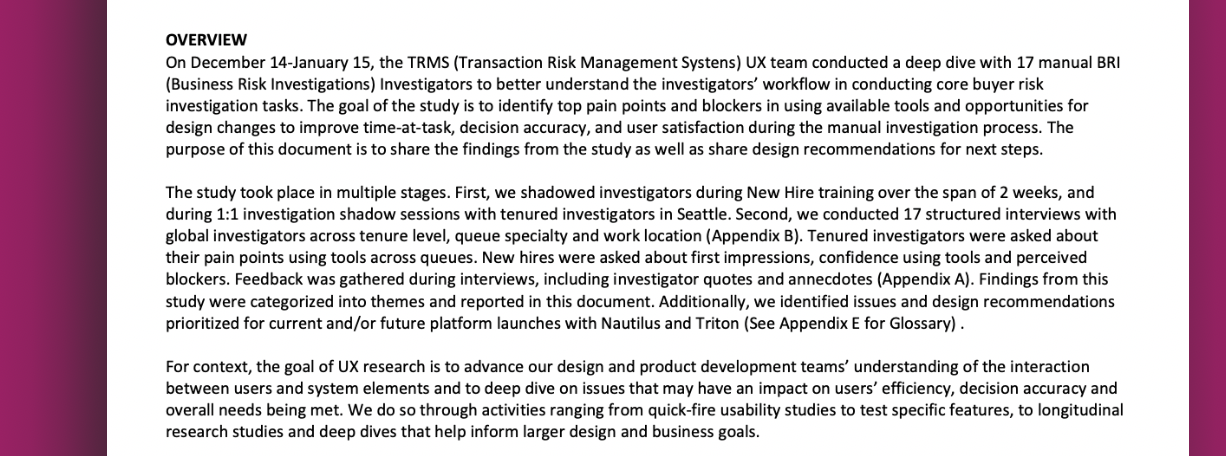
Section 1: Executive Summary & Impact (Half a Page)
Place the conclusion on page one. The first three paragraphs must answer:
Summary of What you did: Which system and what user segments were evaluated?
Summary of How you did it (with an appendix to research methods): Which research methods, across how many users and how long did the study take? Why did you choose this methods?
Project Tenet &Operational Tenet : Tenets are guiding principles that help engineers and PMs make trade-offs independently. More on tenets.
Example
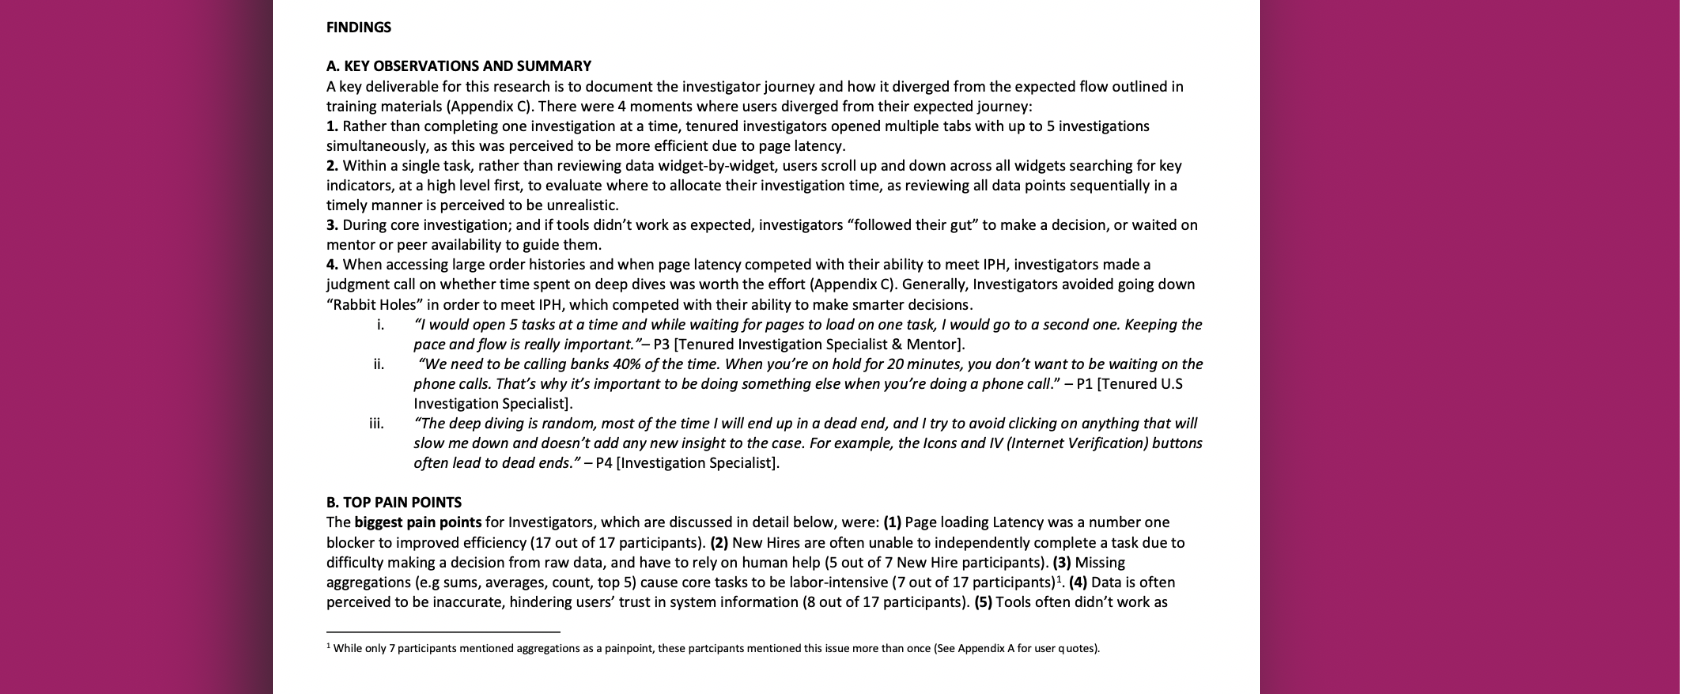
Section 2:key findings & top pain points summary ( Half a page)
Before dragging stakeholders into exhaustive qualitative transcripts or deep methodology details, provide an executive synthesis of the top friction points and systemic blockers.This section gives Directors and Principal Engineers an immediate mental map of the system's operational failure modes:
Top Blocker 1 (Context Switching): Quantify how tool fragmentation forces operators to bounce across multiple disconnected queues, losing working memory context.
Top Blocker 2 (Administrative Friction): Highlight where manual data transcription slows decision velocity.
Top Blocker 3 (System Opacity): Surface where operators lack trust in underlying data recommendations, driving manual recalculations.
Summarizing top blockers upfront ensures that when leadership reads the subsequent methodology and deep-dive sections, they already understand the exact operational stakes.
Example
Section 3: Methodology & Constraints (Half a Page)
Be transparent about the study’s boundaries. Technical stakeholders respect research that clearly identifies its sample limits:
Sample Profile: "5 Zone Leads with >10 years domain tenure; 3 Junior Technicians."
Environmental Constraints: "Conducted on calibrated desktop monitors; does not evaluate field tablet glare or interaction with gloved hands in mechanical rooms."
Section 4: Key Findings — The Data + Anecdote Engine (2 to 3 Pages)
Organize findings around where the user’s mental model broke down, not chronologically by interface screen. For every finding:
The Measured Metric: The failure or delay rate.
The Verbatim Quote: The exact sentence that exposes the user's operational reality.
The Systemic Root Cause: Why the software architecture failed the human.
Example from our University of Washington Facilities Study:
Finding: The Supervisory Messaging Tool Clashed with Operational Autonomy
Data: 7 of 8 participants bypassed the instructional messaging field during task assignment, resulting in an 88% omission rate.
Verbatim Quote: "I am not a micromanager. They should be able to see most of the stuff in the website themselves without my help."
Analysis: The interface assumed a corporate management model requiring conversational instruction. In field operations, the dynamic between a lead and a technician is built on trade craft autonomy. The technician does not need an email; they need structured asset telemetry (schematics, room linkages, parts numbers). Forcing narrative composition turned a supervisor into an administrative bottleneck.
Section 5: Mechanisms, Not Good Intentions (1 Page)
In traditional product development, research reports conclude with a list of "Recommendations." These recommendations almost always fail for a simple reason: they rely on goodwill, memory, and discretionary effort.
A recommendation that reads "We should improve investigator confidence in machine learning flags" or "We should make search more intuitive" is not actionable. When sprint planning arrives and engineering faces technical debt or delivery deadlines, open-ended recommendations are the first items quietly descoped.
A mechanism is not a suggestion. It is a complete, closed-loop operational process that produces a predictable outcome without relying on human willpower. In the context of user research, an Enforceable Mechanism has three non-negotiable components:
The Specific Tool or Threshold: An unambiguous, binary rule embedded directly into software architecture, design systems, or PRD acceptance criteria.
The Inspection Cadence: A recurring, scheduled review where compliance is audited by cross-functional leadership (e.g., Sprint Planning, Design Review, or QBRs).
The Closed-Loop Gate: A hard stopping rule where a feature cannot merge to main, pass code review, or ship to production if the criteria are breached.
To turn qualitative and quantitative research into production software, every finding must be translated from a weak recommendation into a hard mechanism.
Section 6: Appendex & FAQs (1 Page)
Use the FAQ to address the toughest objections Product and Engineering will raise:
"Can't we launch the card view and optimize density in v2?"
Answer: No. Telemetry from our legacy system migration shows that when an interface slows power users down, 82% permanently export data to external spreadsheets within the first week. Once operators revert to parallel tools, re-engaging them costs three times more effort than correcting the layout before release.
Use the Appendices to address deeper questions on research validity and methodology.
Writing Standards for Technical Credibility
To produce a document that engineering and executive leadership take seriously, apply three basic writing standards:
1. Eliminate Imprecise Language
Avoid vague qualifiers that obscure sample size and confidence:
Avoid: "Most users found the search confusing."
Use: "6 of 8 participants clicked the wrong building badge on their first attempt."
2. Separate Observations from Inferences
Keep what the user physically did separate from how you analyze it:
Observation (The Fact): The user clicked the red badge containing the number 3 three times and asked, "Why are there three work orders in this room?"
Inference (Your Analysis): The user interpreted the priority rating as an item counter because of its spatial placement on the building icon.
3. Translate Usability Friction into Operational Cost
Connect design flaws directly to business and operational metrics:
Avoid: "Users felt frustrated by the multi-step form."
Use: "The 3-step modal adds 35 seconds per work order. Across 40 technicians completing 12 orders daily, that introduces ~140 lost operational hours each month."
5. The Operational Practice: The Silent Reading Meeting
The structure of the document works in tandem with how the review meeting is conducted:
Remove Presentation Theater: No slides are projected; no introductory walkthrough is given.
Dedicate the First 20 Minutes to Silent Reading: The document is distributed, and attendees read in silence, adding written questions and comments directly into the margins.
Equalize Information Access: This ensures that all stakeholders—from tech leads to executive directors—absorb the complete context, data, and constraints before verbal debate begins.
Conduct a Page-by-Page Review: Once reading concludes, the facilitator opens page 1 and asks: "Any questions on Page 1? Page 2? Page 3?" The discussion focuses immediately on architectural trade-offs, data verification, and release criteria.
Conclusion
The format through which user research is communicated directly impacts whether engineering teams act upon it. Slide decks are useful for high-level summaries and vision alignment, but complex systems require the depth, causal clarity, and verifiable rigor of written narratives. By structuring research reports around hard metrics, verbatim user evidence, and enforceable engineering mechanisms, design teams can ensure their findings move out of archived presentations and directly into production software.